Best of Funds Strategy
Investing money like the star investors
In the “Best of Funds” strategy, we invest your assets broadly diversified in the most successful value & quality funds.
- Investments in Value & Quality Investing Funds
- Actively managed bond funds as an admixture
- Handpicked individual stocks
- 5 individual risk preferences
Best of Funds Strategy
Investing money like the star investors
In the “Best of Funds” strategy, we invest your assets broadly diversified in the most successful value & quality funds.
- Investment in Value & Quality Investing Funds
- Handpicked individual shares and
- actively managed bond funds for admixture
- (Note: This strategy is only available to investors who are resident in Germany for tax purposes).

20.000€ / 50.000€
Minimum investment
(depending on custodian bank)
0,99% / 1,19%
Service fee
(depending on the custodian bank)
0,5% - 0,8% p.a.
Product costs
10%
Performance Fee
(High Water Mark Principle)
Exclusive Investments
Your access to the most successful value & quality investing funds
In the “Best of Funds” strategy, we invest for you in the funds of the most successful value and quality investors and hand-picked individual shares with a focus on holding companies.
Due to high minimum investment sums and expensive initial charges, these exclusive investments are normally associated with considerable additional costs for private individuals. As an institutional investor, however, we give you access to the significantly more cost-effective institutional tranches. We buy all funds without a front-end load.

Risk diversification
Lower fluctuations thanks to broad diversification
You determine your growth opportunities
Within the Best of Funds strategy, you can choose from five portfolios, which differ in their respective equity or bond share. A higher share of equities generally means more long-term growth potential with higher fluctuations in value.
Conservative
Best of
Funds 20
Long-term preservation of real assets with small fluctuations
Defensive
Best of
Funds 40
Long-term asset growth with moderate fluctuations
Balanced
Best of
Funds 60
Greater growth in the long term with medium fluctuations
Dynamic
Best of
Funds 80
Significant growth in the long term with major fluctuations
Offensive
Best of
Funds 100
Strong long-term growth with major fluctuations
Can’t make up your mind?
During our application process, we will suggest a suitable portfolio based on your knowledge and risk appetite.
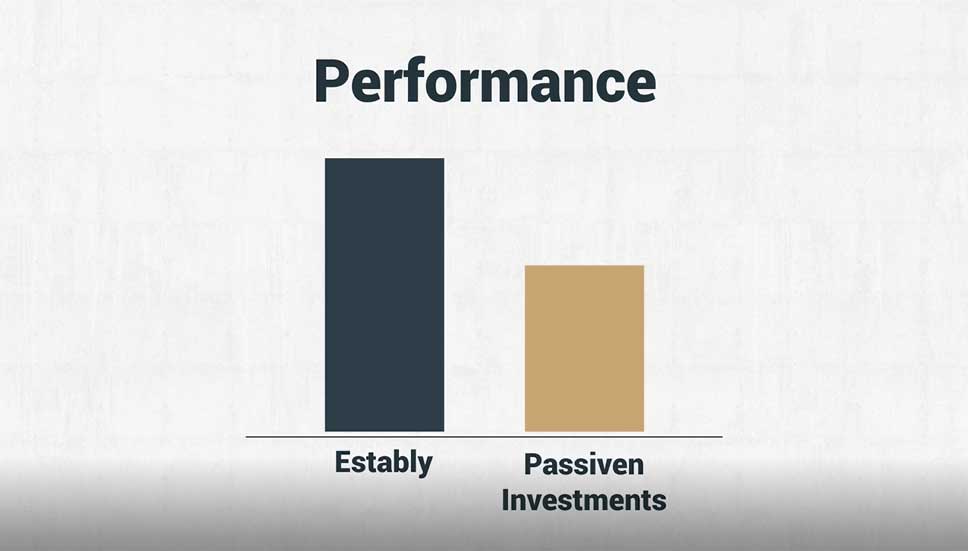
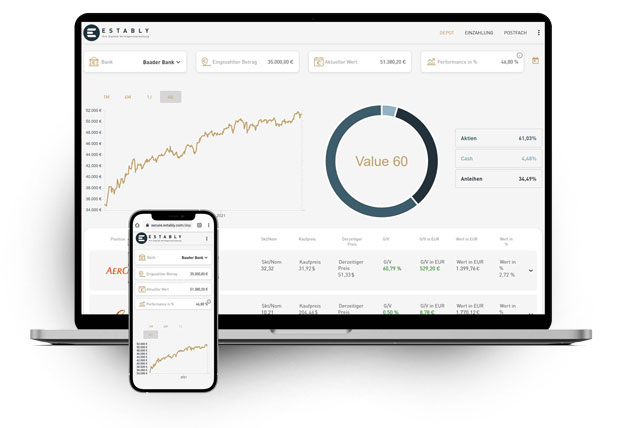
Return
Performance of the Best of Funds portfolios since inception
Our fees: Transparent & fair
The costs for the Best of Funds strategy consist of a service fee, product costs (for the funds used) and a performance fee. However, this is only incurred if we have been able to achieve a new performance high in your custody account.
Your costs depend on the custodian bank you choose:
![]() About Baader Bank
About Baader Bank
The German Baader Bank has state-of-the-art technological infrastructure and is one of the leading investment banks in Germany. For clients domiciled in Germany, Baader Bank automatically remits taxable income.
- From €20,000 minimum investment amount
- For customers resident in Germany:
- Automatic transfer of tax revenues
- Loss offsetting pot
 About the LLB
Founded in 1861, LLB is the most traditional financial institution in the Principality of Liechtenstein. Like most Liechtenstein banks, LLB is very concerned to have sufficient high-quality equity capital.
- From €50,000 minimum investment amount
- Advantages of Liechtenstein as a financial centre (learn more)
- Traditional financial institution since 1861
1.19% service charges
0,33% Bank charges
0,50-0,80% Product costs
Awards
Invest in the winner of real money performance tests
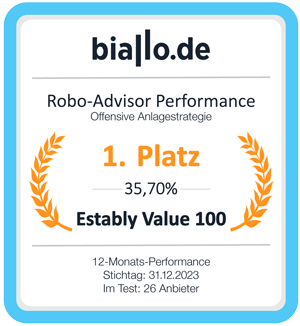
biallo.de
Performance winner 2023
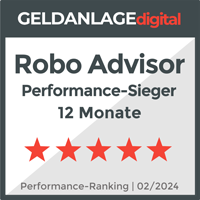
geldanlage-digital.de
Performance winner 12 months (02/2024)
brokervergleich.de
Performance winner 2023
brokervergleich.de
Best risk-return ratio 2023
At a glance
Best of Funds Strategy
- Investments in selected funds and individual shares
- Supplemented by bond funds
- Tax advantages through partial exemption
- Own securities account at Baader Bank or Liechtensteinische Landesbank
- Access to your personal dashboard
- Only for investors with tax residence in Germany
Our strategies
Individual shares
Our “Modern Value” strategy is based on hand-picked individual stocks that are selected according to modern value investing principles.
Funds
The “Best of Funds” strategy enables you to invest in the funds of the most successful value and quality investors.
Gold
This strategy focuses on protecting your assets. To this end, we invest in gold, supplemented by stable currencies.